Free AI visibility Dashboards and performance tracking
*You'll need to bring your own LLM API keys. We're not that generous!
Monitors all major AI platforms
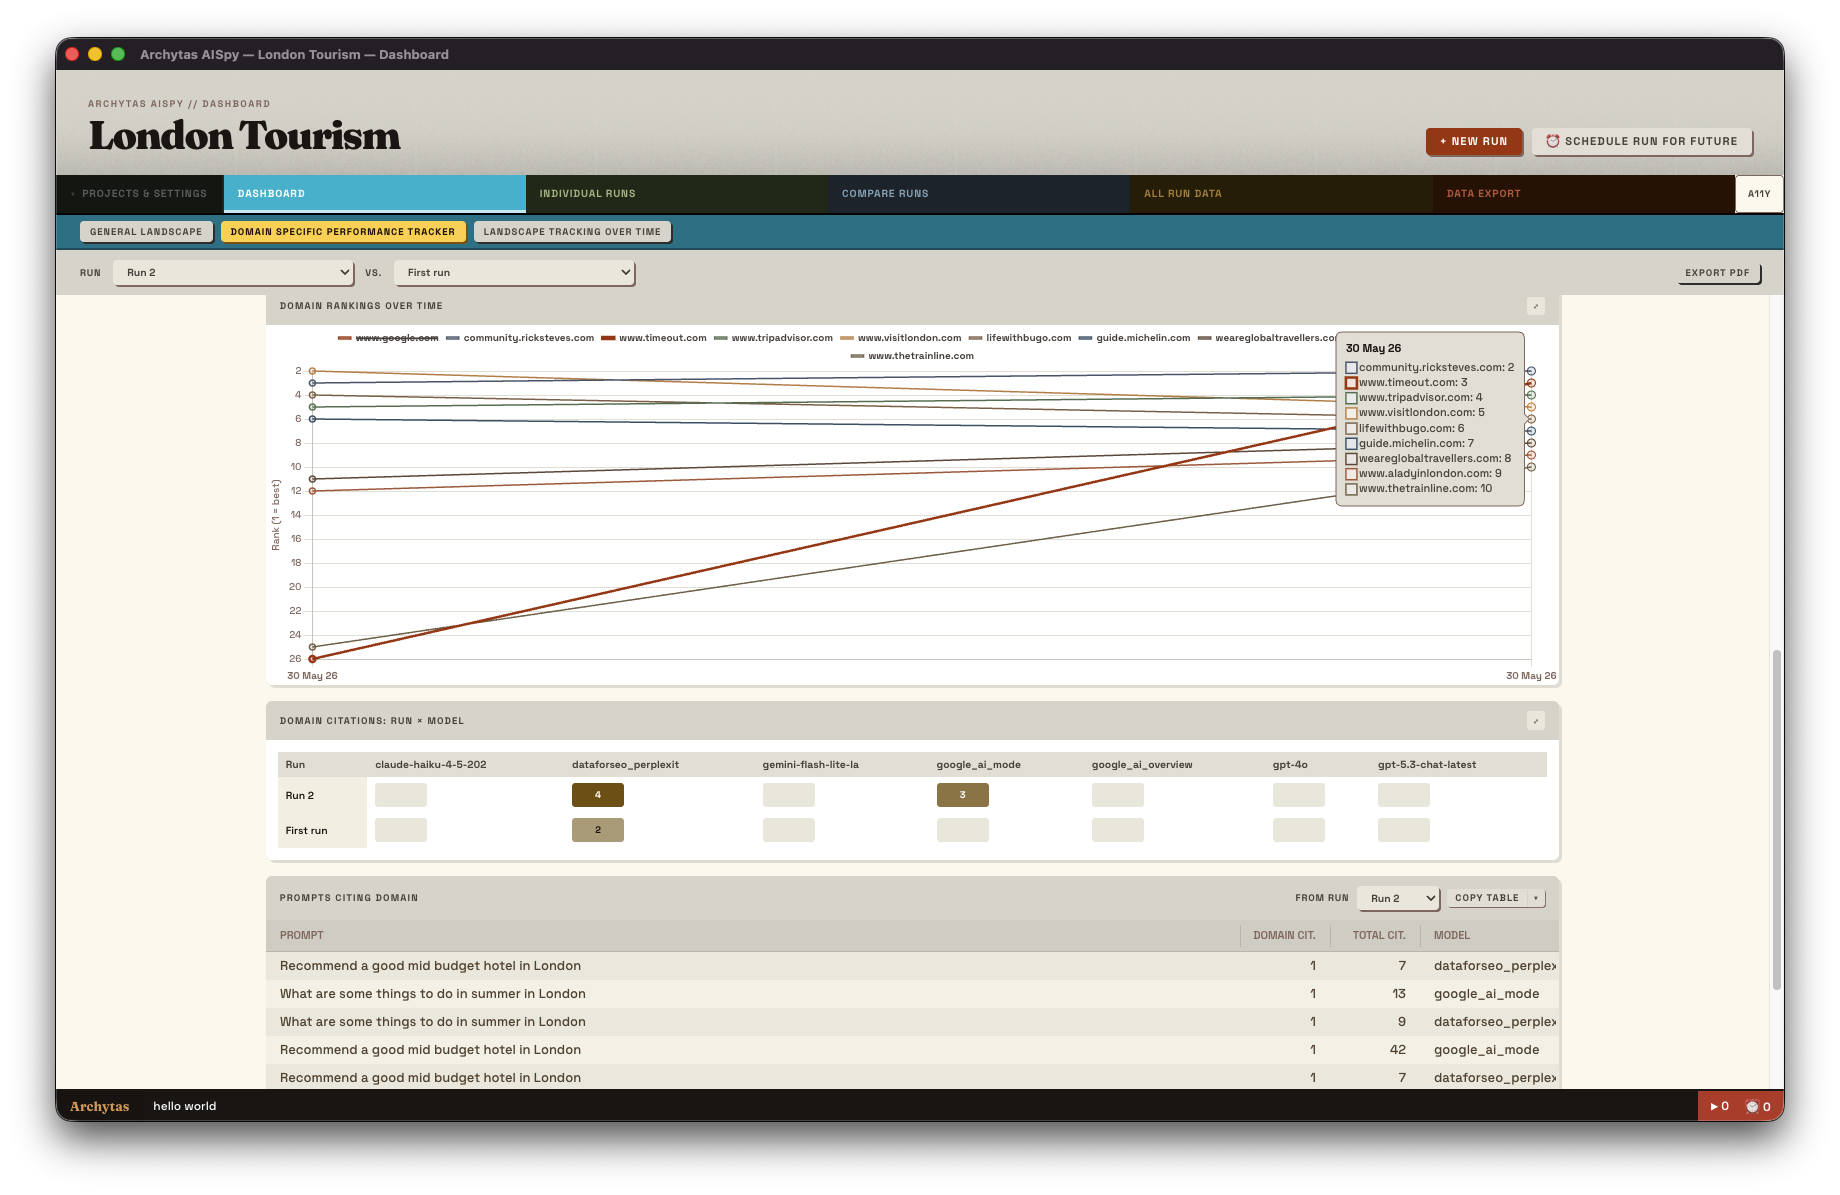
See which websites AI models are citing most frequently across your tracked queries. Bar charts, doughnut share breakdowns, and a ranked table give you an instant read on who AI is sourcing in your space - and where you stand among them.
The Domain × LLM Model Matrix shows which AI models - ChatGPT, Gemini, AI Overviews/Mode and others - are citing which domains. Spot the gaps where you're visible on one model but invisible on another, and prioritise your efforts accordingly.
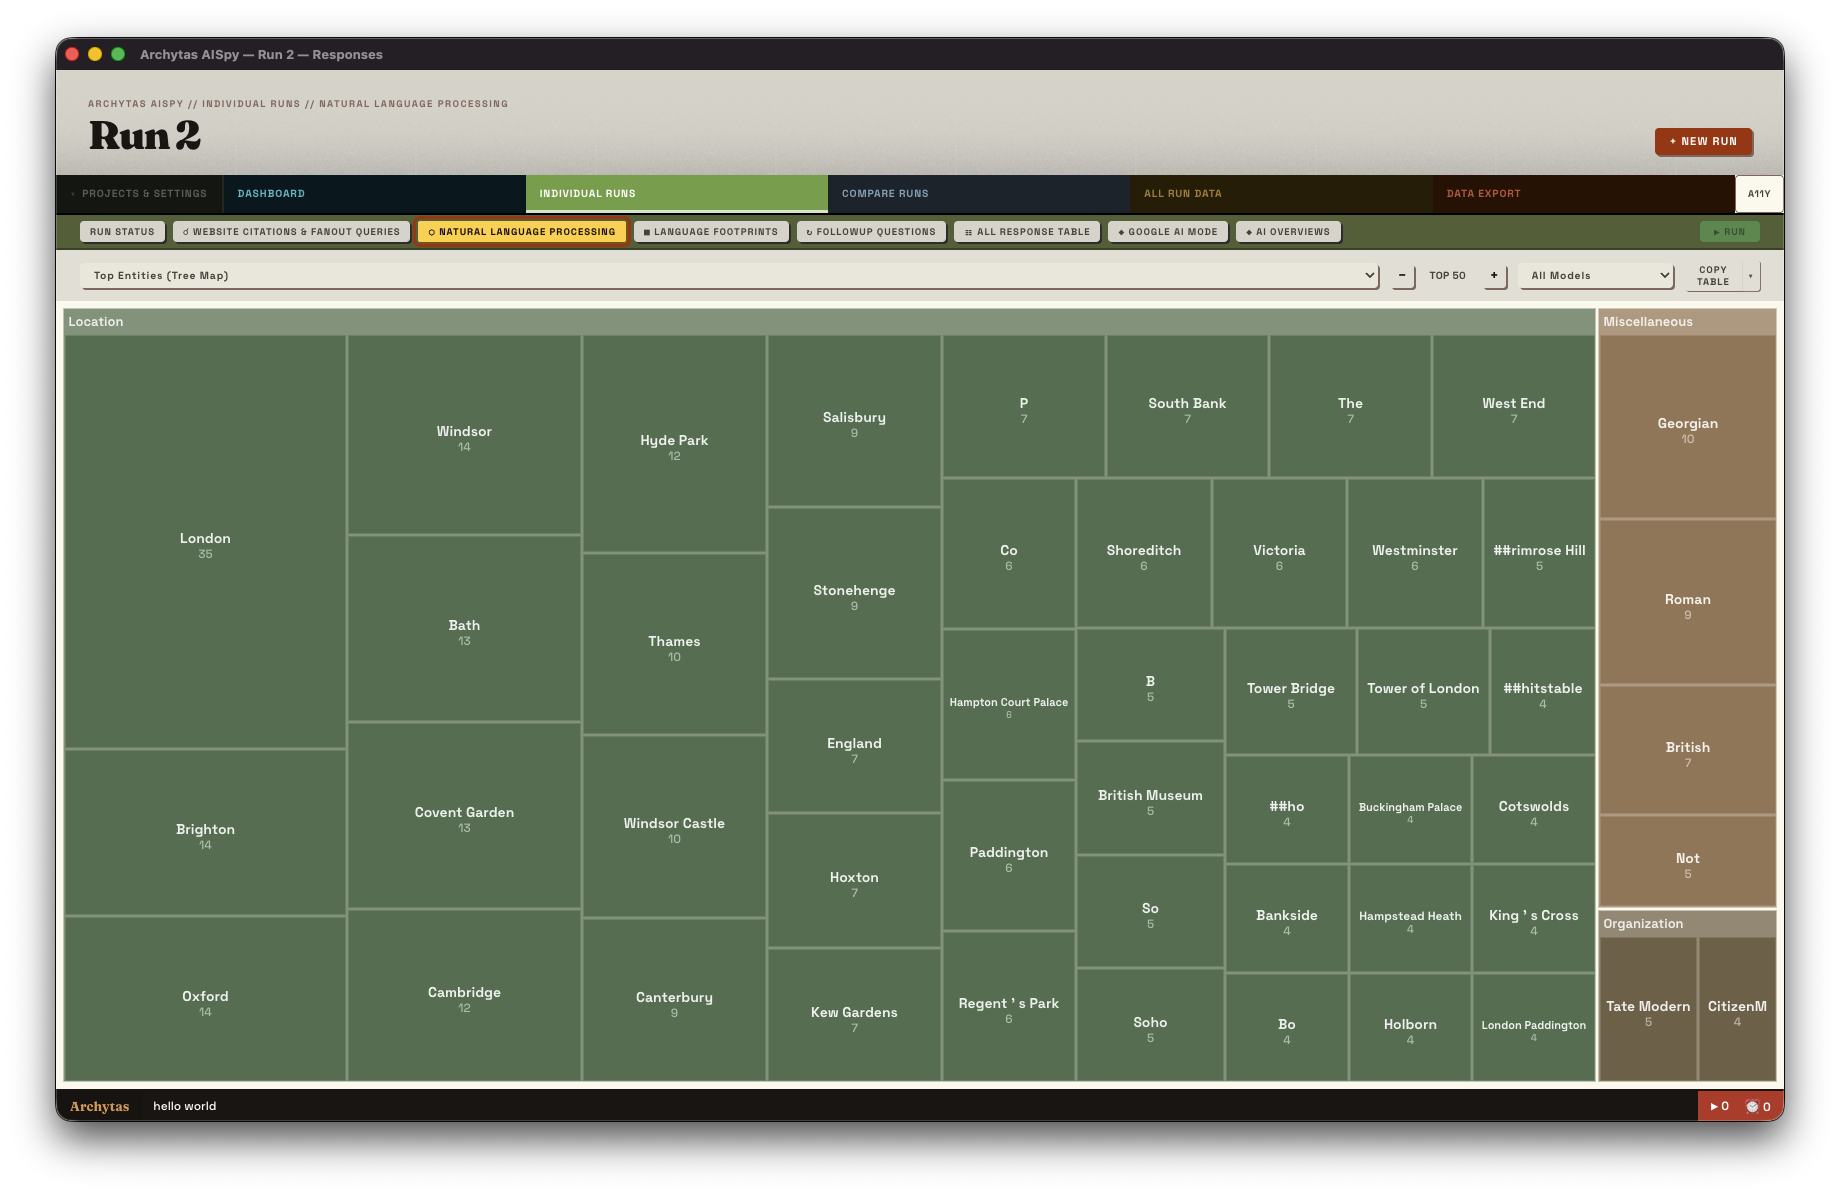
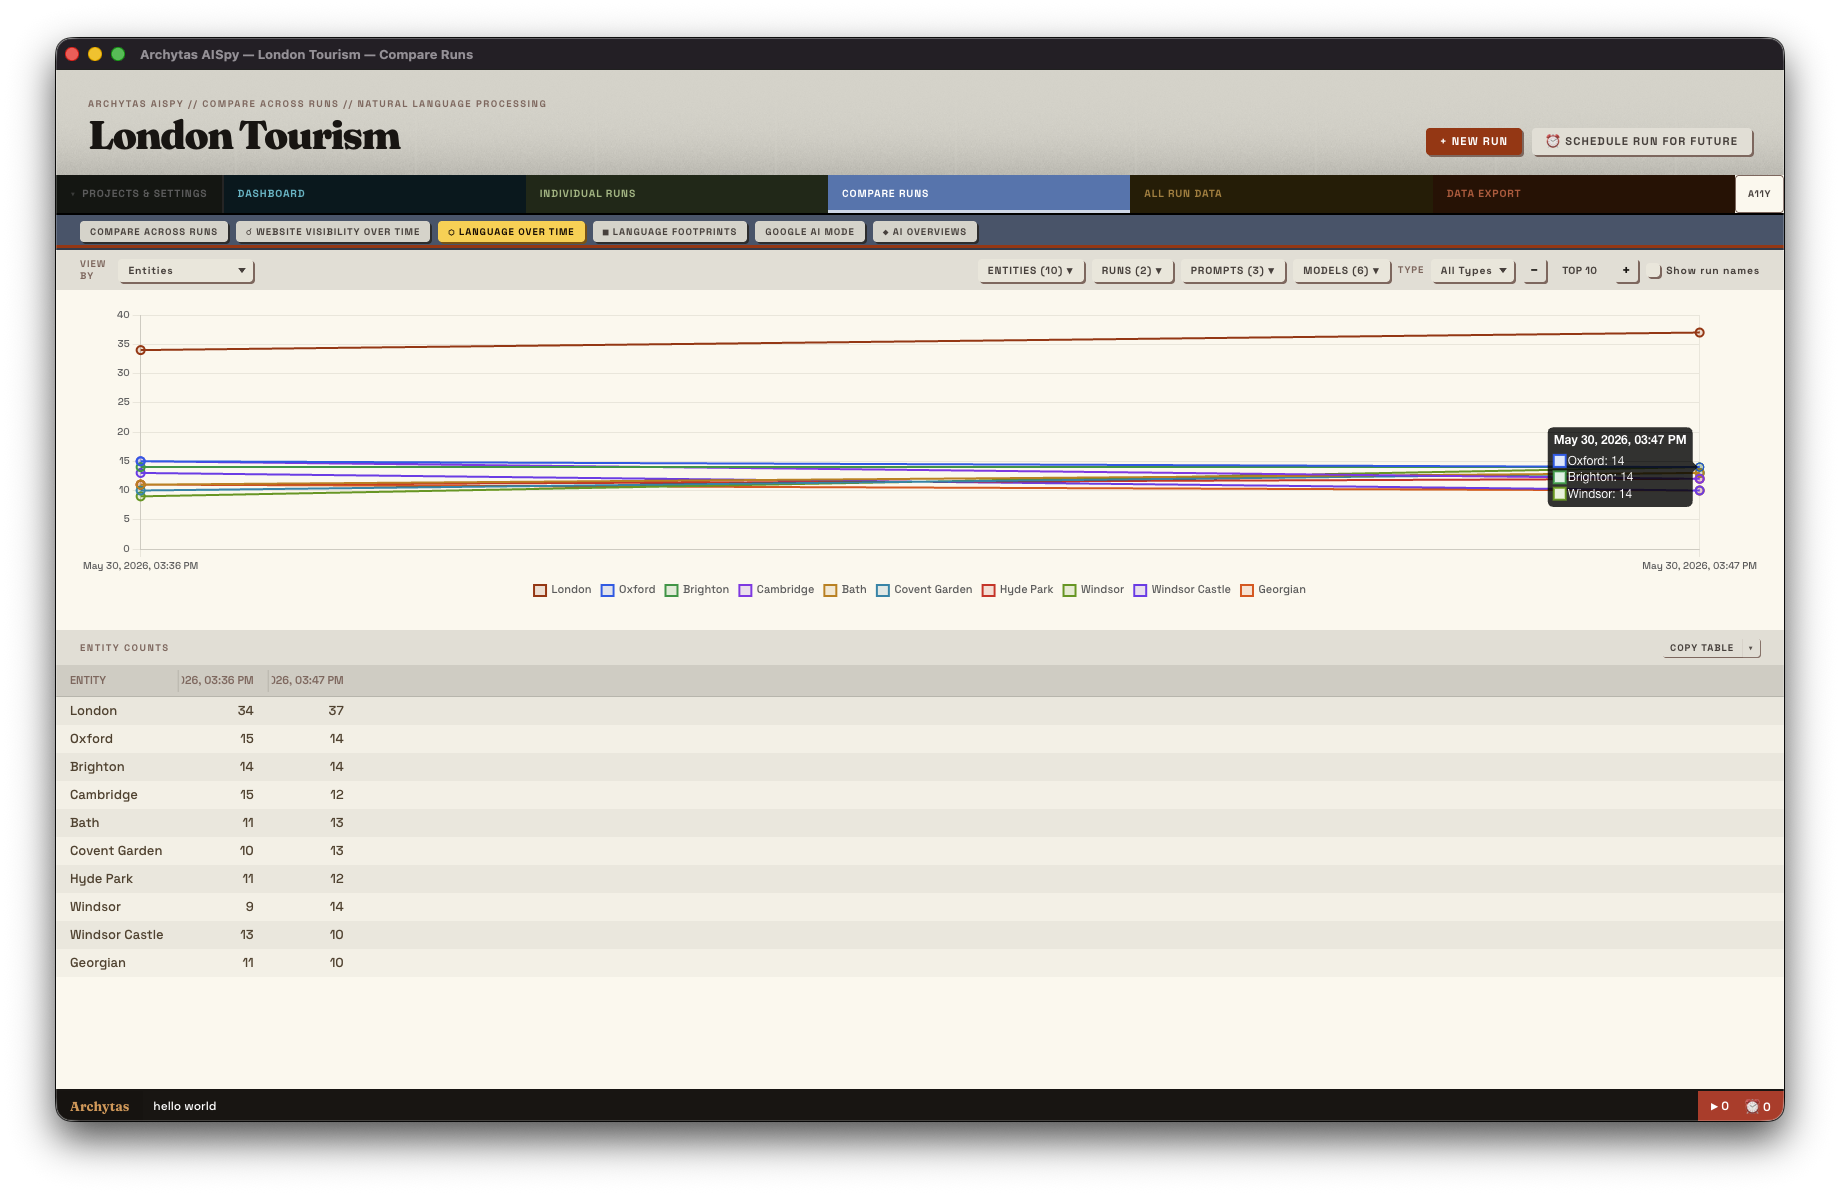
LLMs aren't search engines, and AI visibility isn't just about URLs. Archytas AISpy surfaces the people, organisations, products, and locations AI models discuss with each prompt, alongside a breakdown of the key language patterns appearing in responses. Understand what AI thinks your market is saying about your brand and market over time - not just which URL it is citing.
AI Visibility Performance Dashboards on Mac, PC and Linux
See which domains are getting citations across all your tracked prompts and LLMs. Benchmark your position.
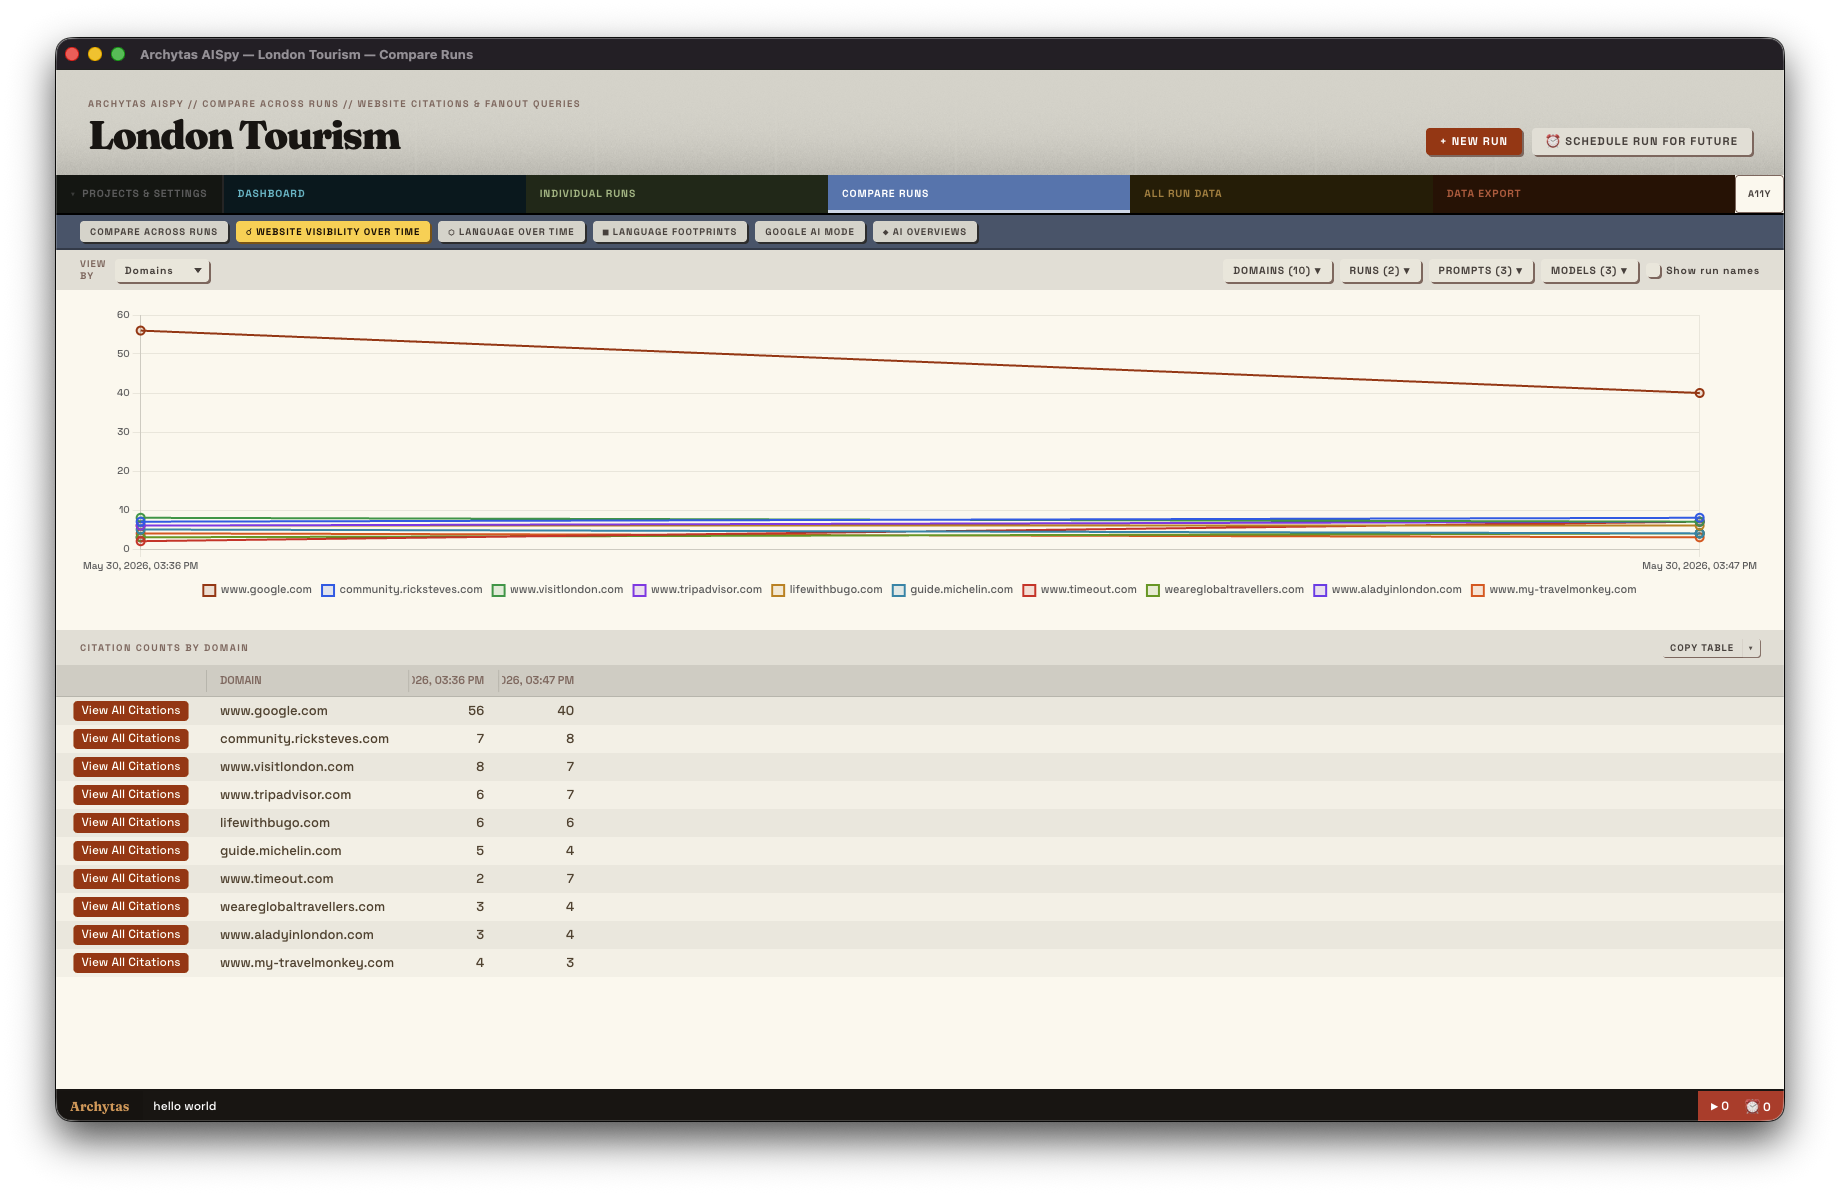
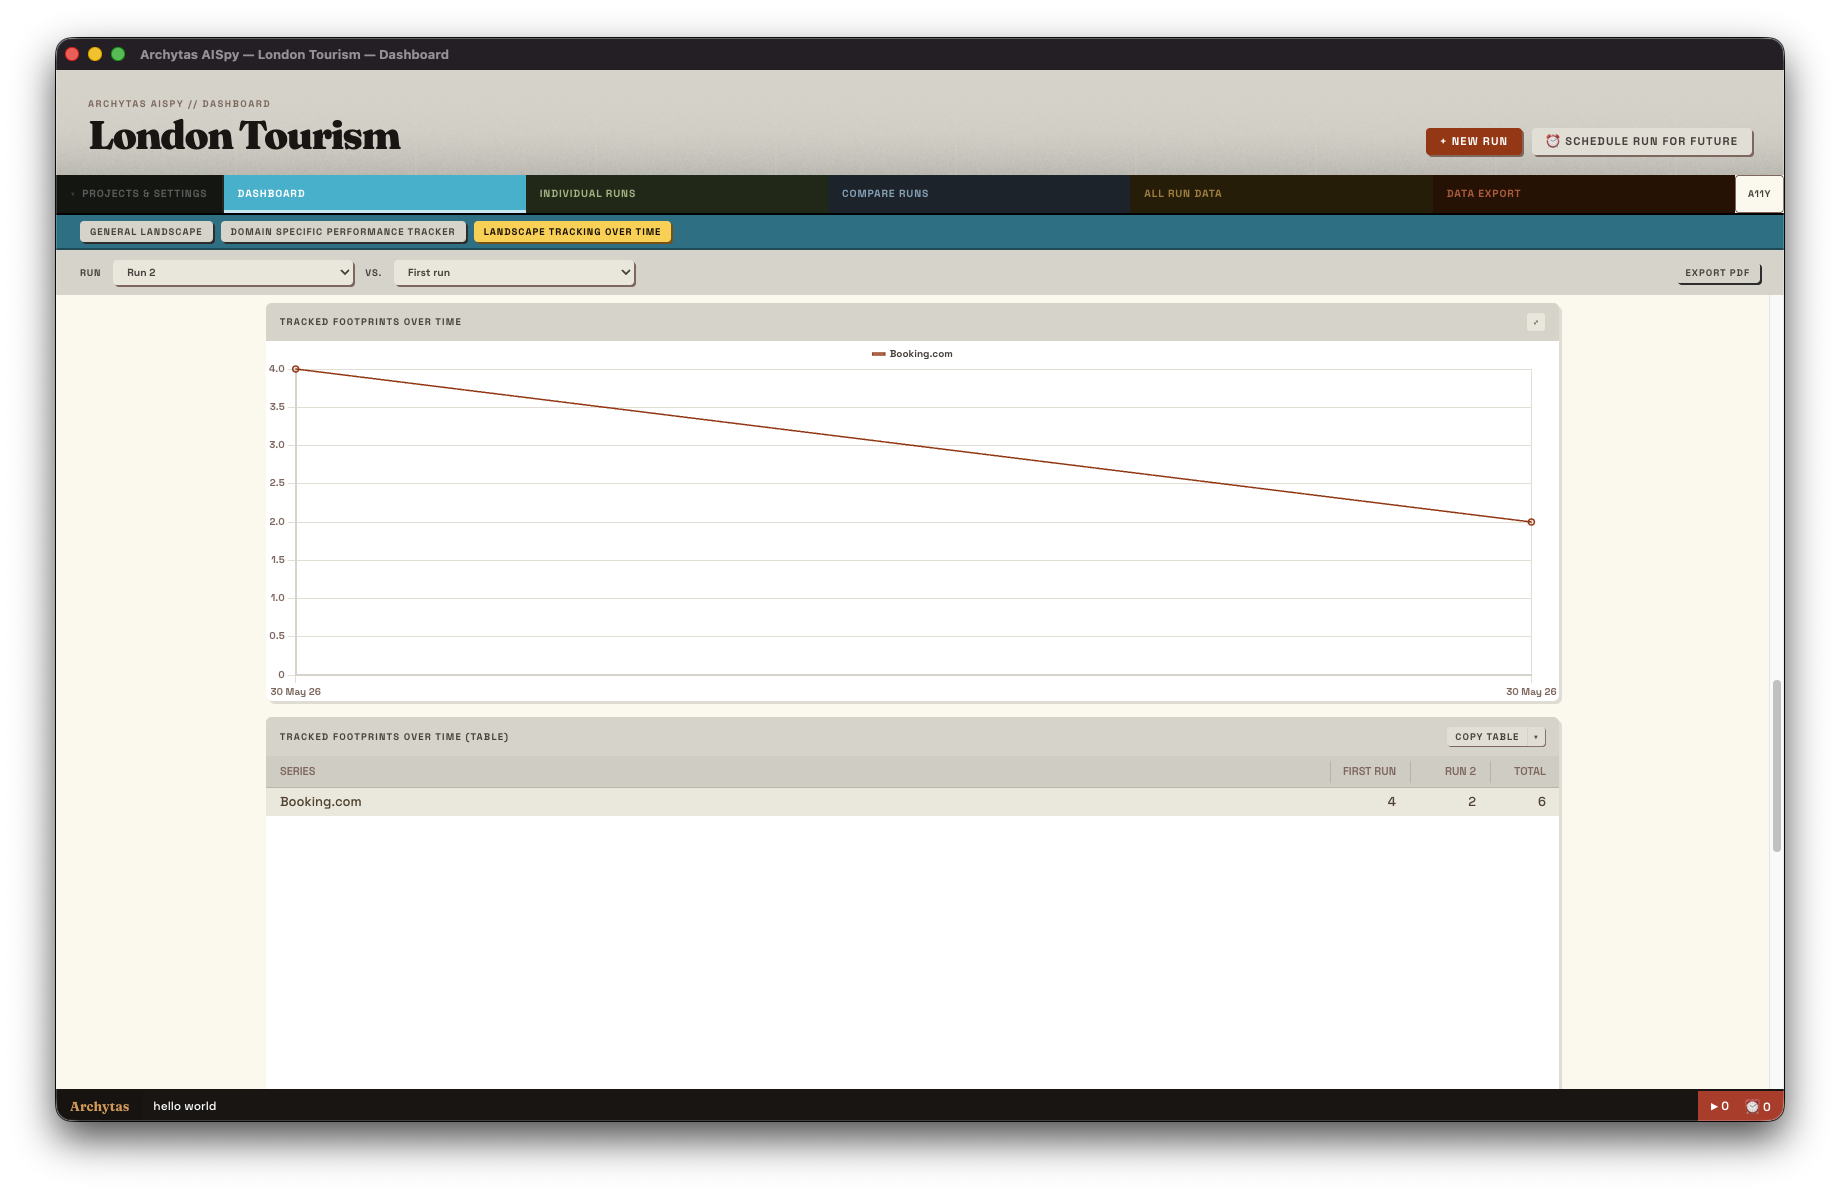
Plot your brand's citation growth (or decline) across all LLMs. Spot when things shifted and correlate with your content releases.
See what language and entities appear most frequently when AI discusses your space. Understand the narrative AI is building.
Compare your performance across ChatGPT, Claude, Gemini and Perplexity. See where you're strong and where you're invisible.
Watch how the language AI uses to describe your space changes. Catch narrative shifts early.
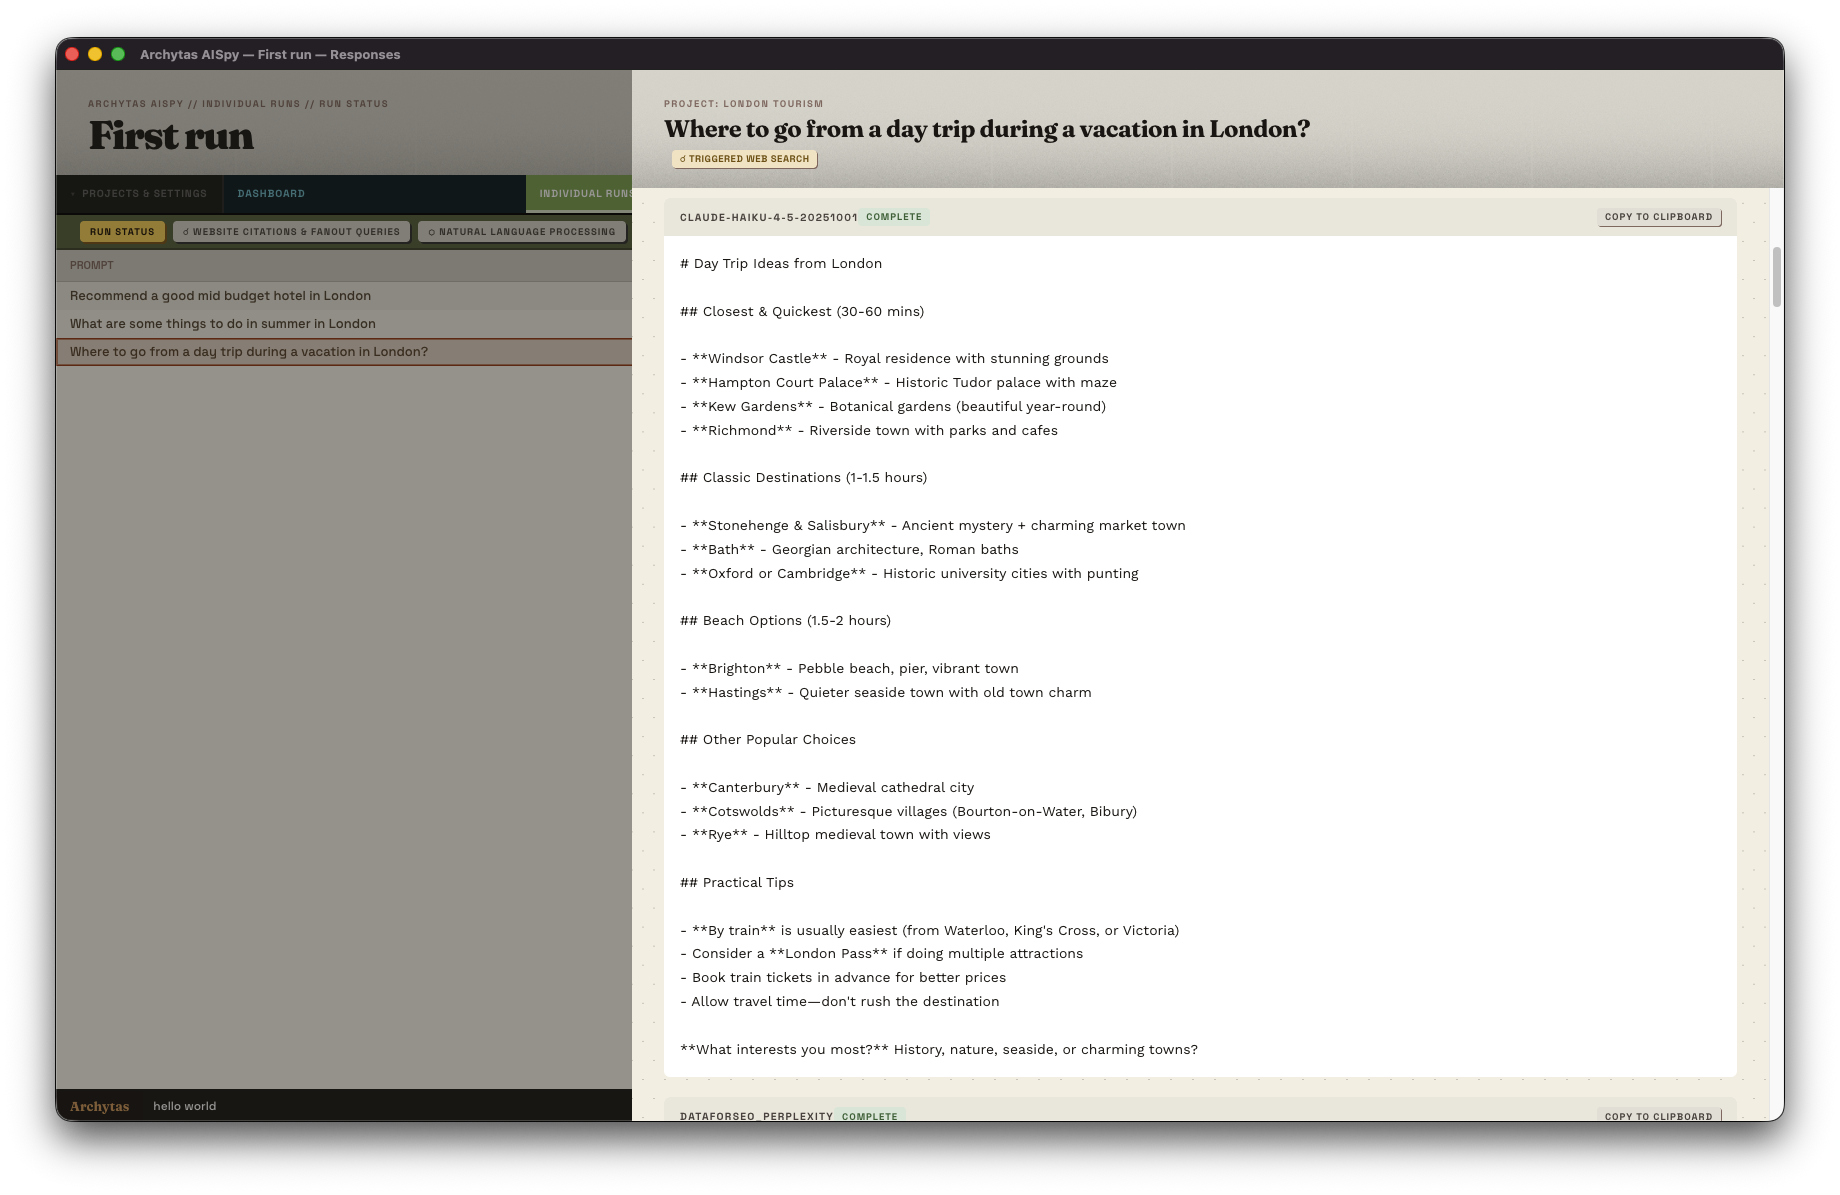
Move from dashboard view to individual prompt responses. See exactly what each AI model said about your brand.
The dashboards cover five use cases - citation and source intelligence (which domains AI cites and their share of voice), cross-model coverage (which models cite which domains), entity and language analysis (the people, brands, and topics AI associates with your space), run-over-run comparison (delta indicators showing what's moved since your last benchmark), and performance tracking over time (citation count, share of voice, and ranking plotted across every historical run).
Yes. You can view aggregate performance across all models or drill into any individual LLM - useful when you want to understand why your numbers look the way they do and which model is driving a particular trend.
Yes. Archytas AISpy's Dashboards can be exported to PDF. You can also integrate into your existing data warehouse, either by exporting the underlying data to CSV or Excel and building your own report, or for the more hardcore analyst you can connect directly to the underlying SQLite database and feed into your BI dashboard or warehouse.
As far back as you've been tracking. Archytas AISpy runs locally and stores everything in a SQLite database, so your history is limited only by when you started running scheduled prompts and how much disk space you have. There's no server-side data retention limit.
Yes. The dashboards are designed to be website-agnostic; every citation and mention is stored and can be surfaced. You can pick who you want to benchmark against from whoever has visibility in that space. This also allows Archytas AISpy to surface the full range of competitors for your target prompts, not just a pre-set list of competitors that may or may not actually be competing for your audience.